




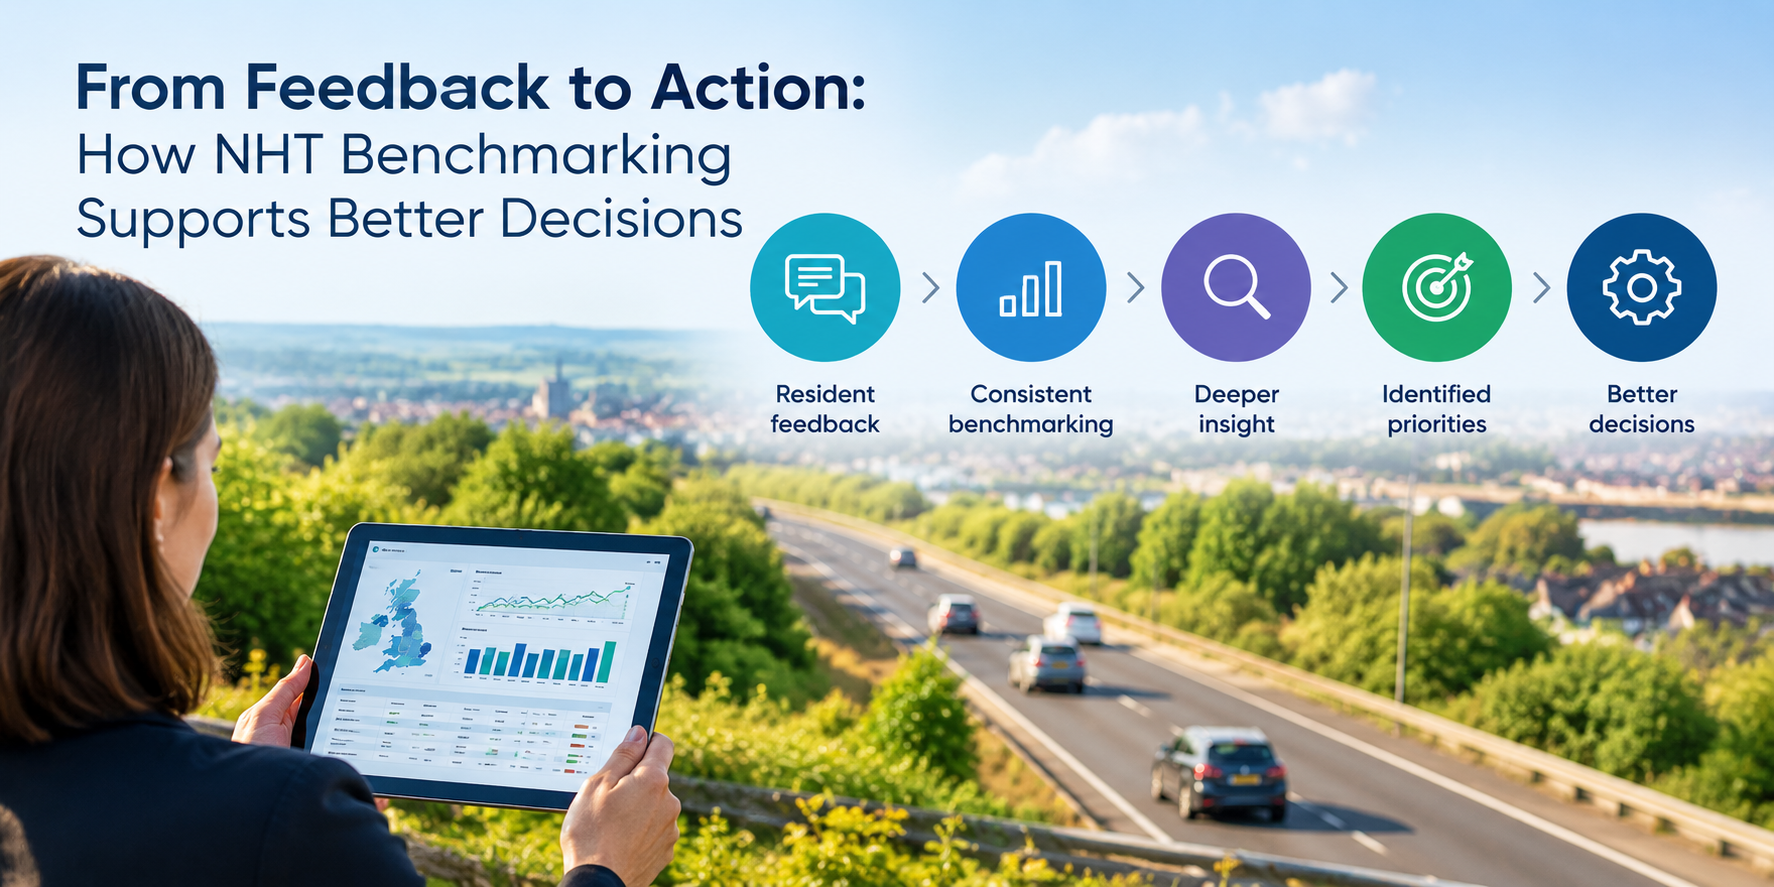
Resident feedback is valuable, but a score on its own only tells you so much. The real value comes from putting that feedback into context – tracking how it changes over time, comparing it with other authorities and looking at it alongside operational, financial and performance data.
This is where benchmarking can make a difference. Used effectively, NHT benchmarking can help Local Authorities understand where performance is changing, identify areas that need further investigation, learn from differences between authorities and make better-informed decisions about priorities and service improvement.
But effective benchmarking depends on more than simply comparing numbers. There are several important steps involved in turning resident feedback into meaningful insight.
Step one: collecting feedback consistently
Benchmarking is only useful when the information being compared has been collected in a sufficiently consistent way.
If every authority uses different questions, rating scales, survey periods and reporting methods, it becomes difficult to determine whether differences in the results reflect genuine differences in service experience or simply differences in methodology.
The NHT Public Satisfaction Survey uses common core questions across participating authorities. This allows comparable indicators to be produced and gives councils a consistent basis for reviewing public perceptions over time and across authority areas.
Consistency supports two important forms of analysis.
Tracking change over time
An authority can examine whether resident perceptions are improving, declining or remaining stable.
This can be particularly useful after:
- A change in maintenance policy
- A new communications approach
- Additional investment
- A service redesign
- A major programme of roadworks
- Changes to public transport provision
- The introduction of active-travel measures
One year’s result provides a snapshot. Several years of results can reveal a direction of travel.
Comparing performance with others
Authorities can also examine their position in relation to national, regional, peer-group or other relevant comparison groups.
This creates context for interpreting the local result.
A score of 48 per cent, for example, has limited meaning on its own. It becomes more informative when an authority knows:
- The national or group average
- The range of results
- Its position among similar authorities
- Whether the highest-performing authorities have improved
- Whether the sector as a whole is moving in the same direction
The purpose is not to declare winners and losers. It is to identify differences that deserve further examination.
Step two: turning responses into usable information
Raw survey responses are unlikely to be the most practical format for decision-makers.
Authorities need structured information that helps them identify significant patterns, compare services and explore possible causes.
NHT reporting supports analysis of results by authority and provides comparisons between authorities, including peer-group and regional perspectives. Members can access benchmarking information through the secure NHT environment and use reports designed for different analytical needs.
This can help teams move from a broad question—such as “Are residents satisfied with highway maintenance?”—to more focused questions:
- Which aspect of the service is causing the greatest concern?
- Has the result changed significantly?
- Is the trend unique to our authority?
- How do similar authorities perform?
- Which authorities have improved?
- Are particular locations or user groups experiencing the service differently?
- Is satisfaction low in areas residents consider especially important?
This is where survey data begins to become management information.
Step three: adding benchmarking context
Benchmarking allows an authority to challenge its assumptions.
Without comparison, a council may regard a result as unavoidable because of national pressures, budget constraints or the characteristics of its network.
Those pressures may be genuine. However, when similar authorities achieve different outcomes, there may be an opportunity to learn.
An authority could use benchmarking to identify:
- Councils with consistently strong satisfaction
- Authorities that have recently improved
- Services where its own results differ significantly from the group
- Areas where strong operational performance is not reflected in public opinion
- Areas where satisfaction is relatively positive despite limited resources
The next step is not to copy another council’s approach without considering local circumstances.
Instead, the authority can investigate what may explain the difference. This could include service standards, prioritisation methods, communications, customer contact, contract arrangements, asset condition or the visibility of completed work.
NHT’s collaborative model also creates opportunities for participating authorities to share experience and learn from good practice, rather than relying only on numerical comparisons.
Step four: connecting perception with performance
Resident feedback becomes more powerful when it is considered alongside operational, financial and asset information.
Suppose an authority records low satisfaction with the condition of local roads.
The survey result identifies the public concern, but the authority would need additional information before deciding how to respond.
It might examine:
- Carriageway-condition data
- The size and composition of the maintenance backlog
- Pothole volumes and repair times
- Planned and reactive maintenance expenditure
- Treatment selection
- Programme delivery
- Customer-contact data
- Roadworks communication
- Results from comparable authorities
This process may reveal that the principal issue is asset condition. Alternatively, it may show that performance has improved but residents are not seeing or understanding the work.
It could also reveal that residents are particularly dissatisfied with how repairs and roadworks are communicated rather than with the technical quality of the work itself.
The NHT Performance Management Framework provides a structure for connecting strategic, tactical and operational measures. It can also be aligned with resident insight so that authorities can examine service performance and customer experience together.
This prevents survey results from being analysed in isolation.
Step five: identifying meaningful priorities
Not every low satisfaction score can or should result in immediate investment.
Local authorities must balance competing needs, statutory responsibilities, asset risks, available funding and corporate priorities.
Resident feedback helps strengthen this process by showing what matters to the public and where dissatisfaction is concentrated.
A practical prioritisation process could consider:
- Importance: How important is the service to residents?
- Satisfaction: How positively or negatively is it currently perceived?
- Trend: Is the result improving, stable or declining?
- Comparison: How does the authority perform against relevant peers?
- Operational evidence: What do technical and service indicators show?
- Risk: What are the safety, financial, reputational or strategic implications?
- Influence: Can the authority realistically improve the outcome?
- Impact: Which action is most likely to produce a meaningful benefit?
This creates a more balanced basis for action than responding to the lowest score alone.
A service may have low satisfaction but limited scope for short-term improvement. Another may have a smaller performance gap but offer a realistic opportunity to improve residents’ experience through better communication or service design.